
This week I decided to give up playing video games because, even though I don’t play every day, when I do, I can end up gaming for hours on end. Sometimes nine straight hours, not logging off until 1–3am. It’s fun in the moment, but afterwards I sometimes realize how much else I could have done with that time. And it’s not just pc gaming. I also find myself playing games on my iPhone or iPad. Since most of these are “free” but loaded with ads, I end up sometimes downloading new games, and then bouncing back and forth between them.
So instead of sinking those hours into my pc, or on my mobile devices, I swapped them for something more productive: professional growth. I updated my website, portfolio, and blog (things I had been putting off for months). I also carved out time to start applying for internships, since graduation is right around the corner and I need real field experience before heading into the design world.
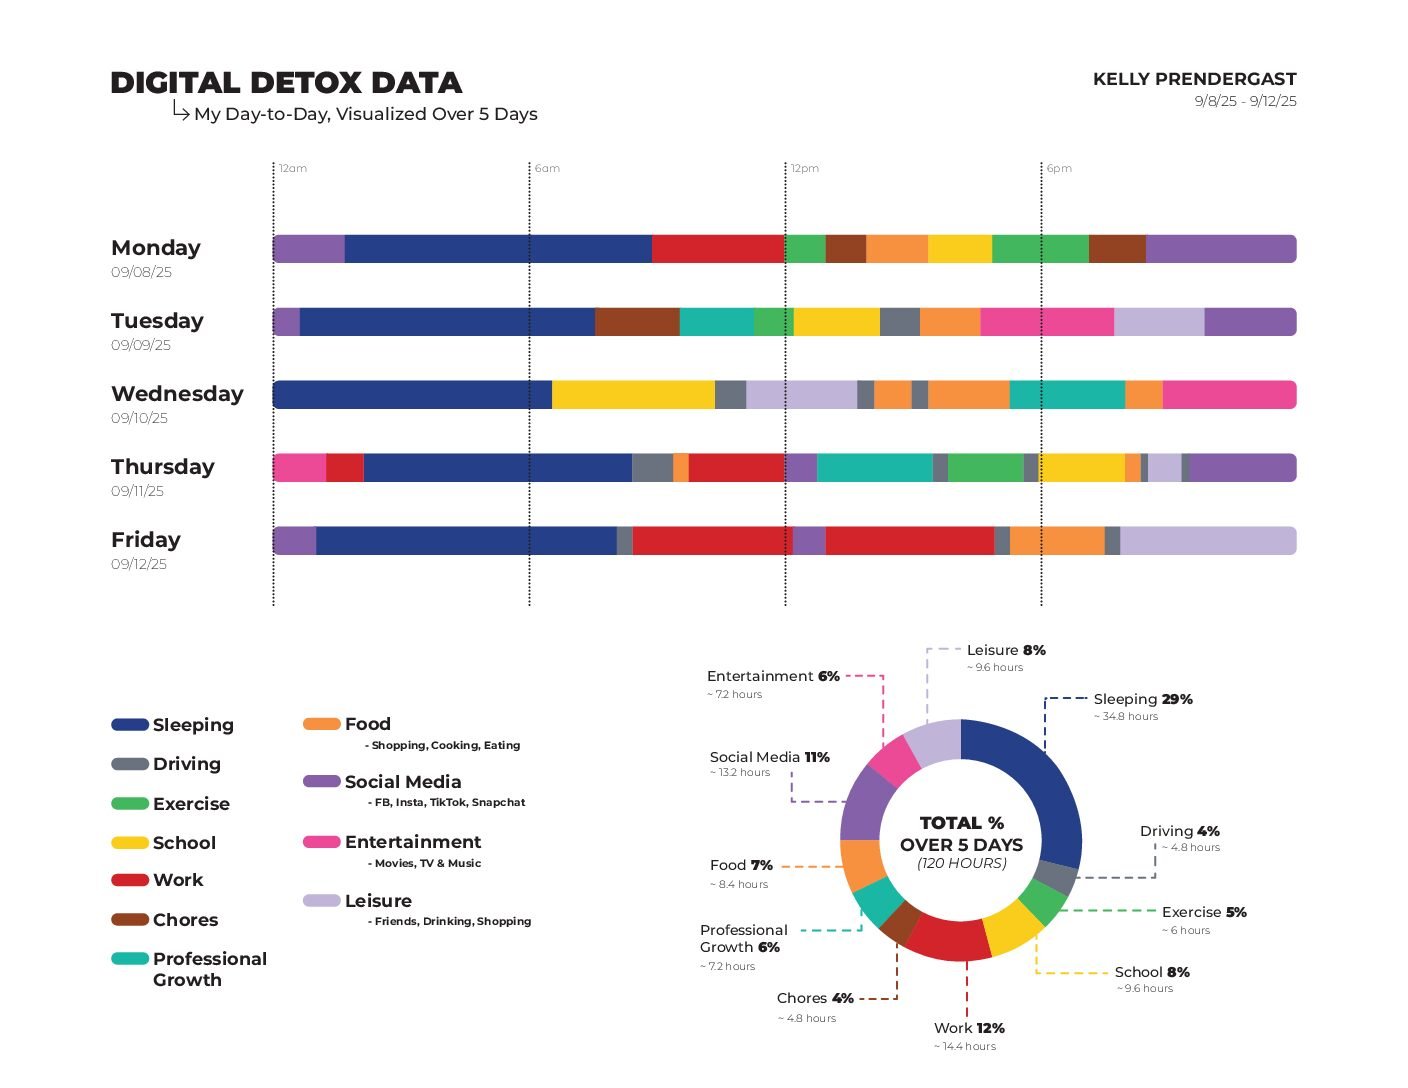
That shift got me curious… how do I actually spend my time in a given week? To answer that, I tracked five weekdays (Monday through Friday) and broke my life into categories:
Visualizing My Time
I collected my data and visualized it in two ways:
- A linear, color-coded chart showing my daily timeline.
- A pie chart that breaks down percentages and hours spent across the five days.
(You can check out the graphs I created below)
This gave me a clearer picture of my daily habits and where my time is really going. My schedule varies a lot week to week, so it was interesting to see things averaged out.
What the Data Told Me
- Sleeping (29%) → Of course, this took up the biggest chunk of my week. I averaged ~7 hours per night, which is “normal,” but I can definitely feel it catching up to me sometimes.
- Work (12%) → Makes sense. As a professor, I’m only required to be in the classroom once or twice a week, but the behind-the-scenes tasks, grading, coursework updates, communicating with students, add up quickly.
- School (8%) → Right now I’m only in one class, so this percentage felt about right. If I wasn’t in school, this would likely shift toward work or leisure.
- Social Media (11%) → Honestly, I thought this number would be higher. Eleven percent over five days still feels like a lot, but maybe being mindful of it is already helping me cut down. (That said, I’ve noticed a pattern: I use social media right before bed, and since I never fall asleep before midnight, I’ve definitely linked those two habits together.)
- Professional Growth (6%) → This category wouldn’t even exist without the detox. These were the hours I would’ve been gaming, but instead I invested in future opportunities. That felt huge.
- Everything else (Food, Exercise, Driving, Chores, Entertainment, Leisure) landed somewhere between 4–8%. Nothing too surprising here.
Inspiration Behind the Visuals
When designing how to present my data, I pulled from two projects for inspiration:
- Feltron Annual Report – I loved the clean, methodical way Nicholas Felton displays data about his own life, making something personal feel almost scientific.
- Dear Data – This project is playful, abstract, and wonderfully human. It showed me that data can tell a personal story without being rigid.
I wanted my own project to sit somewhere in between; structured enough to make sense at a glance, but still reflective of my day-to-day life as a human (not just a statistic).
Connecting to the Bigger Picture
One thing I noticed during this detox is that I’ve already naturally slowed down my use of most social media. Platforms like Facebook and X (Twitter) feel like endless floods of fake news, irrelevant updates, and negativity. I don’t care to post my life online either, so Instagram and Snapchat rarely get my attention.
TikTok, however, is a whole different beast. That app has me in a chokehold. My feed is so perfectly curated it’s almost scary… I open it up and suddenly I’m in a black hole of infinite scrolling. I didn’t give it up during this detox because I knew I couldn’t quit cold turkey. Honestly, I figured if I cut TikTok, I’d just migrate back to other socials I already avoid for good reason. Instead, I’ve been trying to ease into using it less, especially at night before bed when I catch myself mindlessly scrolling.
Johann Hari, in Stolen Focus, talks about how these platforms are engineered to keep us hooked. As he writes, “the algorithm is always weighted toward figuring out, and pumping more and more of that onto your screen to keep you from putting down your phone.” That line hit home because it perfectly describes my TikTok experience.
Hari also points out that “on average, we will stare at something negative and outrageous for a lot longer than we will stare at something positive and calm.” It’s unsettling to realize that not only are algorithms designed to keep us scrolling, but they often do it by serving up outrage or sadness, things that leave us worse off than when we started.
Pair that with the rise of AI, and it’s wild to think about how much control our devices already have over us. If we’re not careful, we end up surrendering our attention, our mood, even our ability to think for ourselves. And in a way, that’s exactly what this detox was about: taking back some of that control, even if just for a week.
Final Thoughts
This detox showed me how much time I can reclaim just by making small swaps, like replacing a night of gaming with updating my portfolio. It also revealed patterns I want to improve, like my late-night screen habits and reliance on social media as a wind-down.
The numbers themselves are interesting, but what’s more valuable is what they represent: an intentional effort to live my days with more awareness, focus, and balance.
References
Hari, Johann. Stolen Focus: Why You Can’t Pay Attention–and How to Think Deeply Again. Crown, 2022.
Feltron, Nicholas. “2014 Annual Report.” Feltron, 15 Oct. 2015, feltron.com/FAR14.html.
Lupi, Giorgia, and Stefanie Posavec. “Dear Data.” Dear-Data, 2015, www.dear-data.com/theproject.
6 Responses
My brother suggested I might like this blog He was totally right This post actually made my day You can not imagine simply how much time I had spent for this info Thanks
I must say this article is extremely well written, insightful, and packed with valuable knowledge that shows the author’s deep expertise on the subject, and I truly appreciate the time and effort that has gone into creating such high-quality content because it is not only helpful but also inspiring for readers like me who are always looking for trustworthy resources online. Keep up the good work and write more. i am a follower.
Your blog is a beacon of light in the often murky waters of online content. Your thoughtful analysis and insightful commentary never fail to leave a lasting impression. Keep up the amazing work!
Your blog is a treasure trove of valuable insights and thought-provoking commentary. Your dedication to your craft is evident in every word you write. Keep up the fantastic work!
I have been surfing online more than 3 hours today yet I never found any interesting article like yours It is pretty worth enough for me In my opinion if all web owners and bloggers made good content as you did the web will be much more useful than ever before
My brother suggested I might like this website He was totally right This post actually made my day You cannt imagine just how much time I had spent for this information Thanks